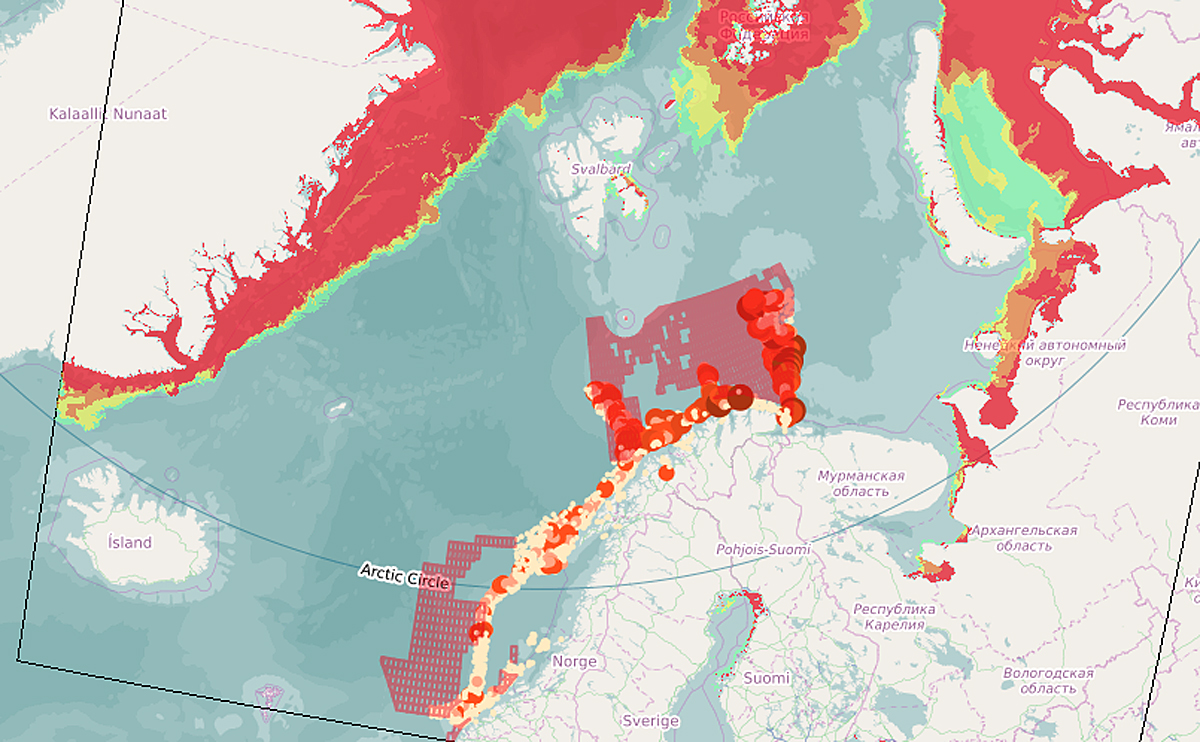
By linking the FishExchange database and other data from the Institute of Marine Research to a map, users can find information on cod, haddock, capelin, polar cod and herring in 2009 and 2010. This will be updated and expanded with data from more years.
Users can create animations that display the dynamics of marine ecosystems and the geographical distribution of fish larvae. The animations show changes from day to day, from spawning time and across the summer. Similar animations showing herring and blue whiting migrations in the Norwegian Sea are available for the years 1995-2003. The animations also display the areas and time periods where the fry are at their most vulnerable.
Several populations and data for several years will be made available for animation. The same applies to the distribution of phytoplankton and zooplankton.
The Sjømil database is another database that also can be linked to maps. It shows the development of the size of commercial stocks. One example are graphs showing the amount of cod in the Barents Sea from 1981 to the present day.
The linking of databases and maps in BarentsWatch provides easy and comprehensive baseline information to anyone who is interested in the marine fish stocks. The facts open up for unbiased information about northern areas. They also improve the possibility of coexistence between special interests.