There is also a trend of thinner sea ice looking to be more dynamic and easily influenced by external forces like wind and ocean currents. A detailed forecasting of the sea ice is therefore also important for operations in the northern areas.
In BarentsWatch you will find products that give a general picture of the current ice situation and a map suitable for tactical navigation in sea ice covered areas . The maps with the highest level of detail covers only the Norwegian sector of the Arctic, with emphasis on the area around Svalbard and the Barents Sea.
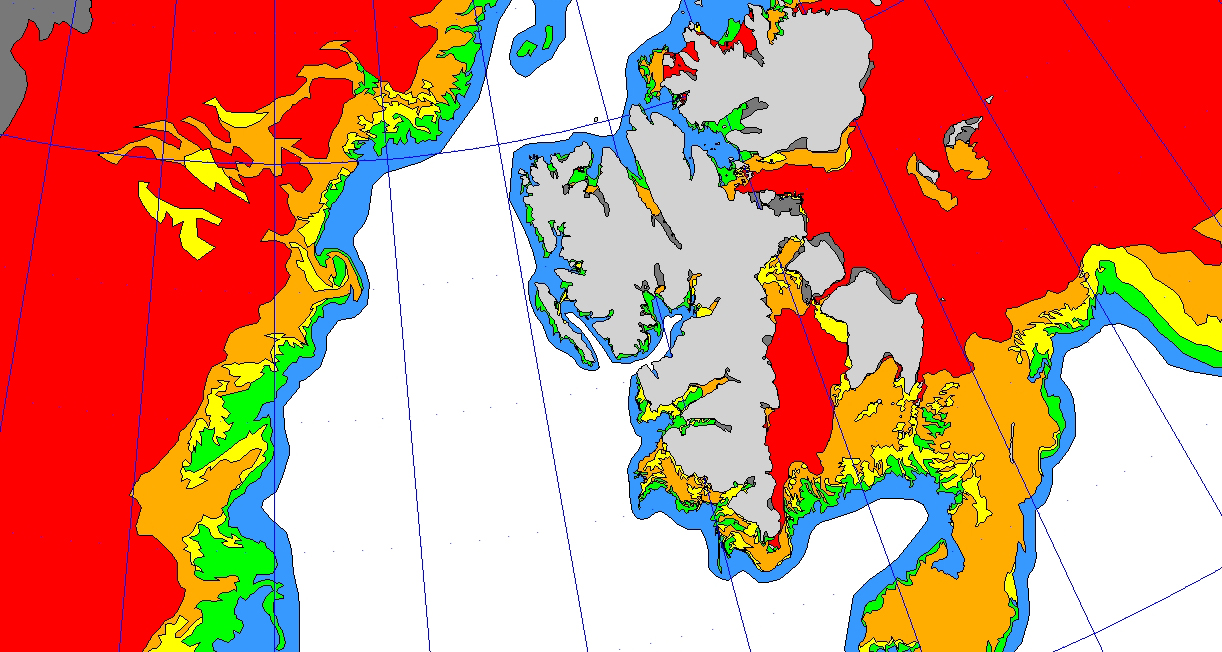
Global and regional ice-charts
The products are based on satellite observations and sea ice forecasts. Later it will also be made available climatological data of sea ice.
The automatic products have a global coverage and are updated daily. The horizontal resolution is relatively coarse making the products most suitable for giving a general overview of the current ice- situation. It automatically generates products for sea ice concentration, sea ice edge, and sea ice-type classified as first-year and multi-year-sea ice.
The manually-generated products have a significantly higher degree of detail, but covers only the Norwegian part of the Arctic with focus on Svalbard and the Barents sea. The product indicate classes of sea ice concentration and are produced every weekday based on a manual interpretation by skilled operators using satellite data obtained from early morning and throughout the day. The ice chart products are issued by the end of the day and are suitable for use in tactical navigation.
What is new?
Ice conditions can change significantly throughout the day. In BarentsWatch you have access to the latest ice concentration analysis for each satellite picture as soon as it has been analyzed by the operators. This will give users faster access to the analysis. Areas covered by several satellite images can have a more frequent update. In BarentsWatch these pictures will appear as ice charts (near real time).
Forecasts of sea ice
Sea ice forecasts are based on a model layout that covers the northern North Atlantic with a horizontal resolution of 20 km and a forecast time covering 0-72 hours ahead of time and a time resolution of 6 hours. The model is based on coupled ocean and sea ice model. The product is updated twice daily and shows the concentration of sea ice.
What’s in the near future ?
Users of the ice service have requested a more frequent update of the high-resolution ice charts with also updated products in the weekends. At Meteorological Institute the aim is therefore to establish an automatic classification of high resolution satellite images. Such a procedure could provide detailed ice analyzes also at night and holidays and the product will mainly be limited by the availability of detailed satellite data.
The Meteorological Institute also works to increase the horizontal resolution of our seas and ice models. For the Arctic, it will go from the current 20 km model and to a 4 km model. This will increase the details significantly. Efforts to introduce such a model has started and it is expected that the first results can be displayed in BarentsWatch by the end of 2013.