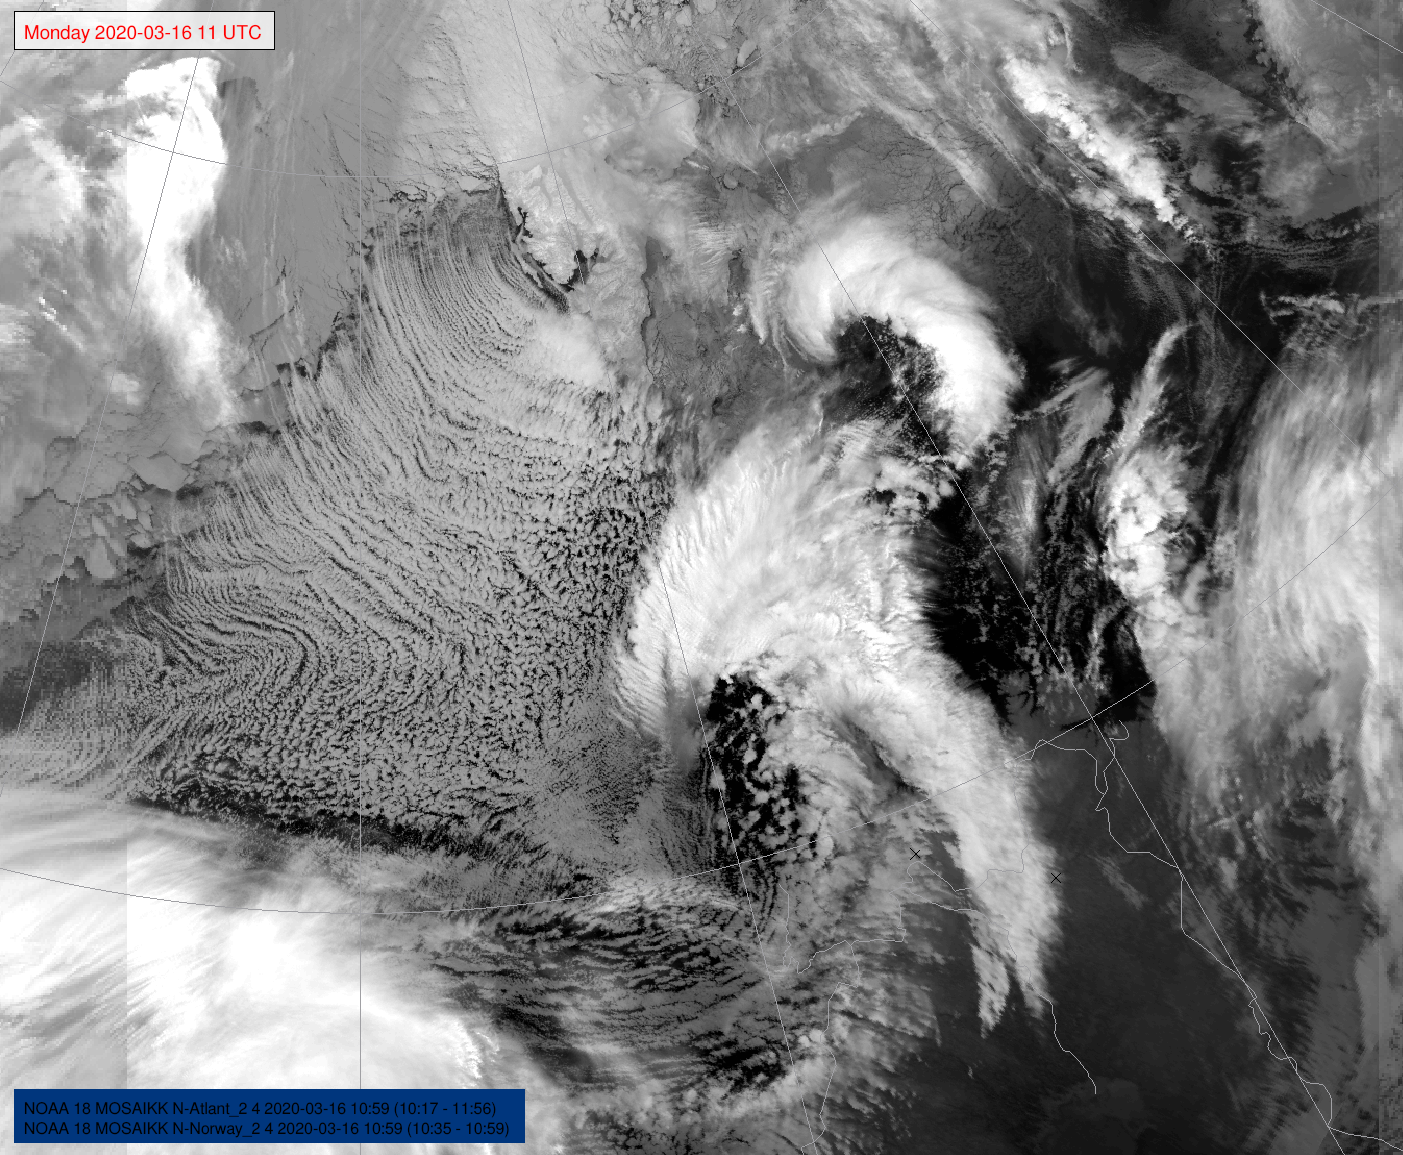
These weather phenomena are small, intense low-pressure systems which form in the winter over Arctic waters. With a diameter of 200-600 kilometres, they resemble tropical cyclones but are smaller in extent and intensity.
Polar lows arise when frigid air from the Arctic icecap or cold landmasses flows out over the warmer sea. Drawing heat and moisture from the water, this creates a type of weather characteristic of thunderstorms. If the overlying atmosphere is also cold, the result is an extremely unstable air mass.
Thunder clouds create a strong upward flow of air, which generates a local area of low pressure at the surface. This in turn generates wind at low levels. In the most unstable conditions, the wind becomes strong enough over a large area to form a vortex and give rise to a Polar low.
Climatology
Such phenomena occur over the whole Norwegian and Barents Seas, and are most common from the Trøndelag coast of mid-Norway to the edge of the icecap in the north, and from longitude 0° to Novaya Zemlya in the east.
The Polar low season extends from October to May, with most cases concentrated in December-March. On average, there are 12-15 events involving one or more individual low centres annually across the whole area.
Such lows generally relate to wind directions between west and north off Norway’s northern Nordland and Troms counties, and north-west to north-east off Finnmark county in the far north.
Weather, wind and waves around a Polar low
Weather conditions can shift from calm to storm in minutes with Polar lows. That means people must be particularly alert to such systems.
The average observed wind strength is a strong gale, and approximately every fourth Polar low gives rise to storm force winds.
A satellite image of a Polar low captured on 7 January 2009. Taken with a synthetic aperture radar (SAR), the photograph provides a detailed picture of winds at the sea surface. Photo: European Space Agency (ESA).
As a rule, the strongest winds are found to the right of the eye when viewed in the low-pressure system’s direction of movement.
Since most Polar lows generally take a southerly course, this means in practice that the winds are usually most powerful to the west of this track – typically in an area extending 50-100 kilometres from the eye.
Conditions are more changing on the other side of the system. Periods of virtual calm or even offshore winds can occur, with clear weather prevailing in the eye. However, things can change rapidly there as well. A north-east gale and snow can often blow in after the Polar low has passed.
The boundaries between these different elements are similar to the fronts observed in a normal low-pressure system, but tend to be sharper.
Many eyewitnesses have reported winds rising from breeze to gale in less than 10 minutes, and their evidence is supported by observations and other measurements.
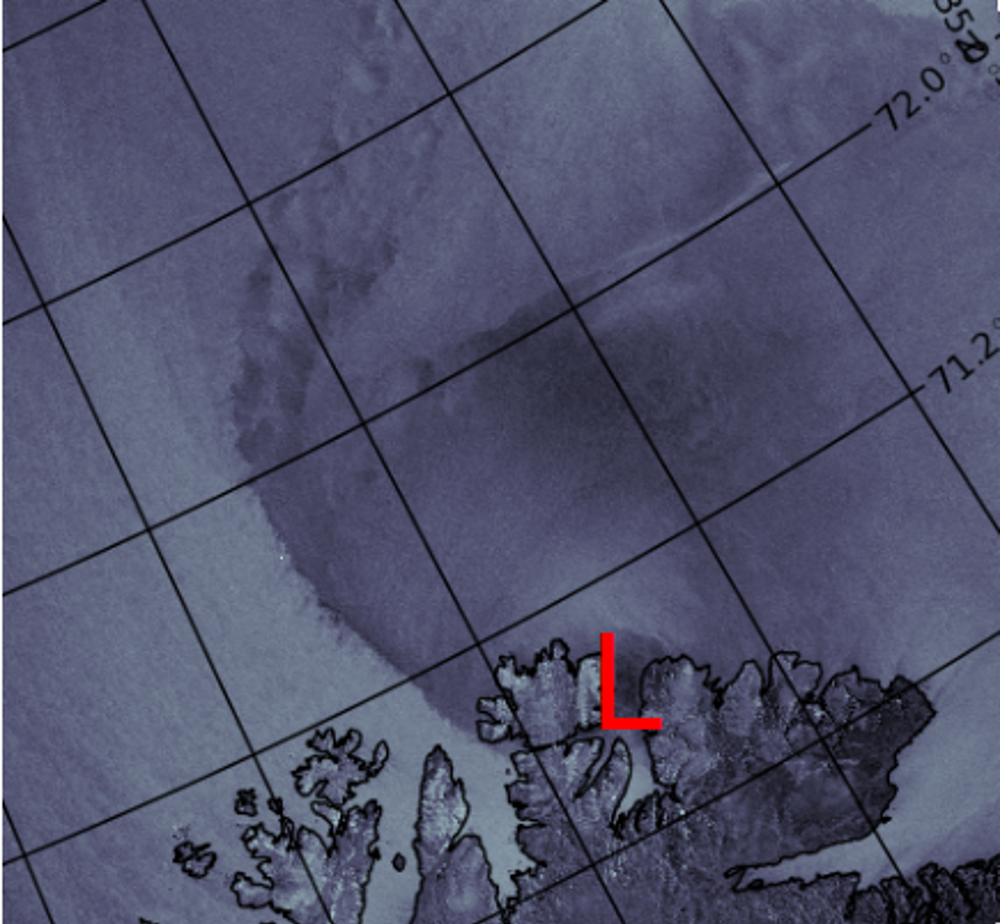
One of the most detailed views ever obtained of winds around a Polar low is depicted in the photograph above, taken by the Asar sensor from the ESA’s Envisat satellite. Surface winds are strongest in the white areas and less powerful in the dark zones.
A sharp boundary is clearly visible between the powerful north-west wind on the left of the shear zone, and a weaker north-easterly further east. The actual eye can be seen as a dark area with a virtual calm over the mouth of the Tana Fjord, indicated by an L.
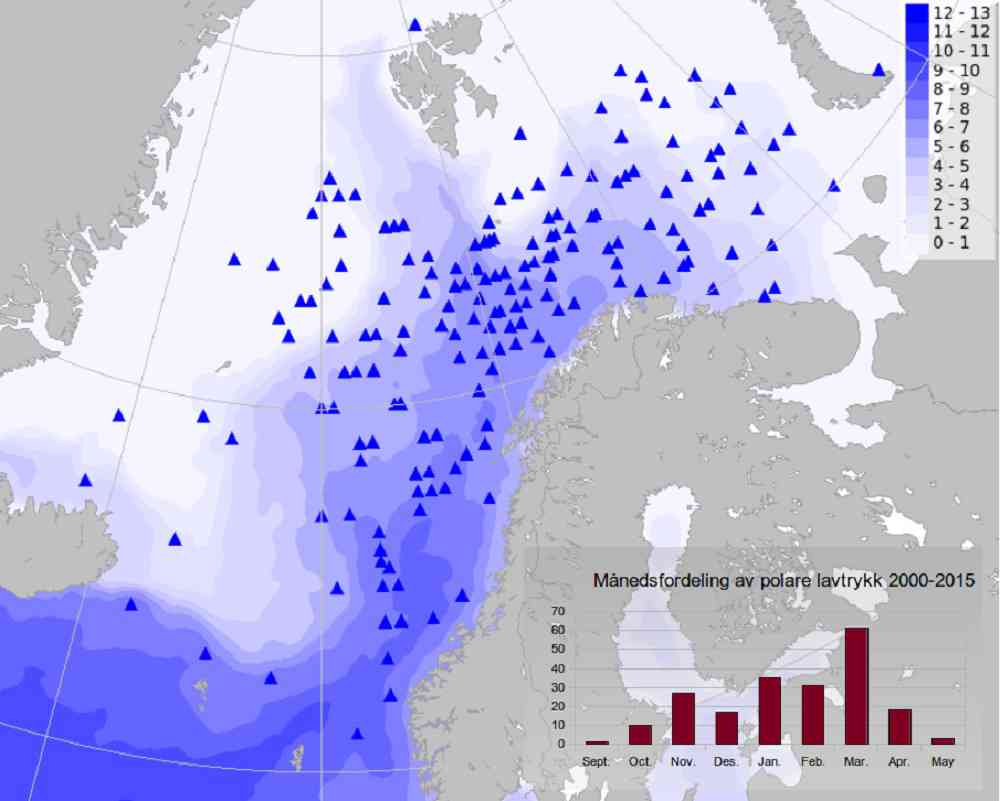
The triangles represent points where Polar lows have formed. The blue hatching shows the mean temperature in January and indicates a typical winter distribution. These low-pressure systems have a tendency to form when air flows from pack ice and cold surfaces to the relatively warmer sea. (Source: MET/Noer)
Few observations of wave heights around Polar lows exist, but an increase from five to nine metres in less than an hour has been recorded. Since waves are related to wind strength, they are at their highest in the western sector.
Polar lows are accompanied by heavy snow showers with blizzards and visibility of less than 100 metres. This kind of weather often creates traffic problems on land, and airports are commonly closed down for periods.
The combination of strong winds and blowing snow can also produce a risk of avalanches in places where the snow accumulates.
Icing on ships is not common close to land in northern Norway, but will probably be experienced more frequently further north in the Arctic Ocean where temperatures are lower. However, few observations exist.
Tracking Polar lows
The projected path of a Polar low can be plotted and shown on a chart. Such plotting is restricted to low-pressure centres measuring 150-600 kilometres across, since most Polar lows fall within these limits.
Weather systems smaller than this – such as local areas with powerful squalls – are filtered out of the plots since they are readily picked up by other types of forecasts.
The plotted paths are calculated only where atmospheric conditions are very unstable. Combining several types of criteria avoids false alarms related to other kinds of weather.
Courses are calculated for 42-hour intervals, and the plot shows the track of the low-pressure system during that period.
Path probability was also calculated earlier using an ensemble prediction system (EPS). Based on a smaller area, this used a series of parallel calculations with almost identical starting conditions to compute the likelihood of the low-pressure track.
A large number of similar solutions from different starting points was interpreted to imply that the forecasts had a high degree of accuracy.
Where the 2015-16 season is concerned, MET Norway has decided to test the same model over a larger area. This covers the whole Norwegian and Barents Seas and extends well north of Svalbard.
A large number of parallel calculations cannot be run for such a big area. Instead, a single calculation based on the actual observations is performed. That means losing information about uncertainty in the forecast.
On the other hand, this approach frees up capacity so that the calculation can be performed four times a day – twice the previous frequency.
That in turn provides a better basis for forecasting dynamic weather conditions such as Polar lows, which are known for their rapid development and short duration.
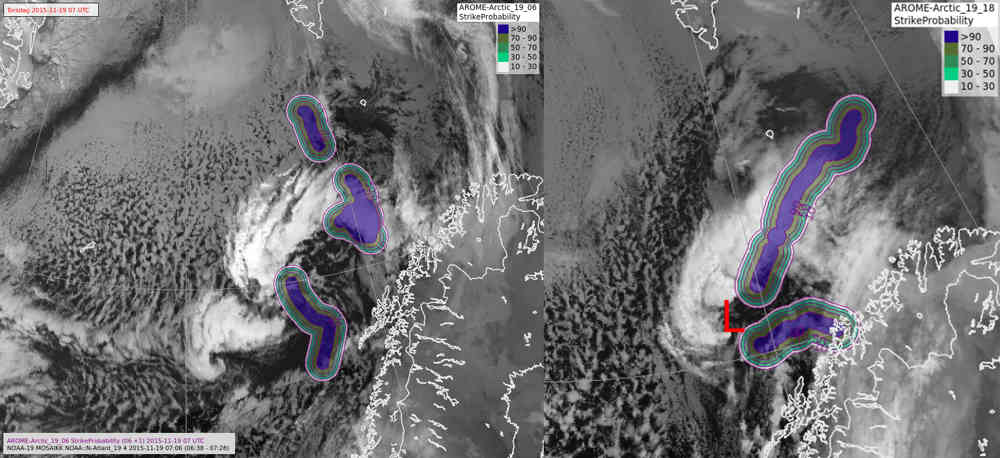
A composite image of a Polar low north-west of Andenes in northern Norway, with the plot which shows its future track. This system took a rather unusual course north-eastwards, and was correctly forecast by the plot routine. Another smaller vortex developing in the latter part of the forecast period is also included here, and shows a path towards northern Troms.
Calculations using the model provide a relatively good description of the most important characteristics of a Polar low. Since observations in the Arctic remain very sparse, however, the model will have problems with precise positioning of these systems.
This currently represents the main weakness in the model’s ability to forecast Polar lows. To correct for it, forecasts are commonly compared with observations from satellites.
MET Norway is currently the only organisation in the world to run a fine scale model in the European Arctic. This provides an opportunity to study many Arctic weather phenomena in detail.
Abrupt shifts between gale-force winds and blizzards and calm, clear conditions can occur over less than a kilometre in a Polar low. That makes assessing the forecasts a somewhat imprecise business.
Changes to the path plot should be interpreted as an increased chance of a Polar low in the area. The weather will otherwise be unstable, with heavy snow and periodic gales.
The plot provides a good indication of the expected path to be taken by the low-pressure system, and thereby of the areas which will be affected.
Source: MET/Gunnar Noer/Hanneke Luijting.